Generation Aware Analysis
The problem?
The .NET GC is generational, it makes the assumption that allocations are broadly divided into two classes, either they are short-lived (e.g. temporary objects) or they are long-lived (e.g. constants, caches for repeated uses). This assumption is often true, but once in a while, that’s not true, often due to programmer mistakes. If a pile of objects meant for short-term usage is leaked into gen2, that can cost a short-term spike in ephemeral GC latency, and a long-term memory cost for storing them. We would like to be able to detect it and analyze what happened.
Scenario
Here is a sample program that demonstrates such a leak. This is the whole program, a copy with the project files can be found here.
namespace GenAwareDemo
{
    using System;
    using System.Diagnostics;

    class LongTermObject
    {
        public ShortTermObject leak;
    }

    class ShortTermObject
    {
        public ShortTermObject prev;
        public byte[] weight;
    }

    class Program
    {
        static void Main(string[] args)
        {
            Console.WriteLine("My process id is " + Process.GetCurrentProcess().Id);
            Console.ReadLine();
            LongTermObject LongTermObject = new LongTermObject();
            GC.Collect();
            GC.Collect();
            for (int phase = 0; phase < 2; phase++)
            {
                // The 0th phase is an emulated startup phase and should be ignored.
                int counter = 0;
                for (int iteration = 0; iteration < 10000; iteration++)
                {
                    ShortTermObject head = new ShortTermObject();
                    for (int i = 0; i < 1000; i++)
                    {
                        ShortTermObject next = new ShortTermObject();
                        next.weight = new byte[1000];
                        next.prev = head;
                        head = next;
                    }
                    counter++;
                    // Emulate a leak of a ephemeral object to LongTermObject.
                    if (counter % 1000 == 0)
                    {
                        Console.WriteLine("Leaked");
                        LongTermObject.leak = head;
                    }
                }
            }
        }
    }
}
Roughly speaking, every ShortTermObject has a weight of 1000 bytes. In each iteration, we create 1000 of them, arranged in a linked list, and then it will be discarded. Once in a while (i.e. when counter % 1000 == 0), the linked list is leaked into the LongTermObject.
To make this post easier for first time readers, let’s assume we already observed that the promoted bytes are usually 1MB, but once in a while the promoted bytes spikes up to 2MB. To understand what happened, we would like to capture that moment.
For the curious, at the end of this post, we will discuss how we can use the performance infrastructure to discover this information.
Capturing
Starting from .NET 5.0, we can use the generational aware analysis tool I introduced in this PR to capture the moment when the promotion happens.
To use the feature, set the following environment variables before launching the process.
set COMPlus_GCGenAnalysisGen=1
set COMPlus_GCGenAnalysisBytes=16E360
set COMPlus_GCGenAnalysisIndex=3E8
We would like to command the runtime to perform a generational aware analysis and capture the moment when a gen 1 GC promoted more than 1.5 MB (16E360 is 1,500,000 in decimal). To avoid capturing the promoted bytes corresponding to the startup phase, we ignore the first 1,000 GCs (3E8 is 1,000 in decimal).
After the process is launched, it will create two files in the current directory:
gcgenaware.nettracegcgenaware.nettrace.completed
The former file is the trace for further analysis, the second file is empty, it is used to signal the analysis is over. For long-running processes that do not stop, we can monitor this file.
For now, it has to be done on the launch, there is no alternative.
Analyzing the captured trace.
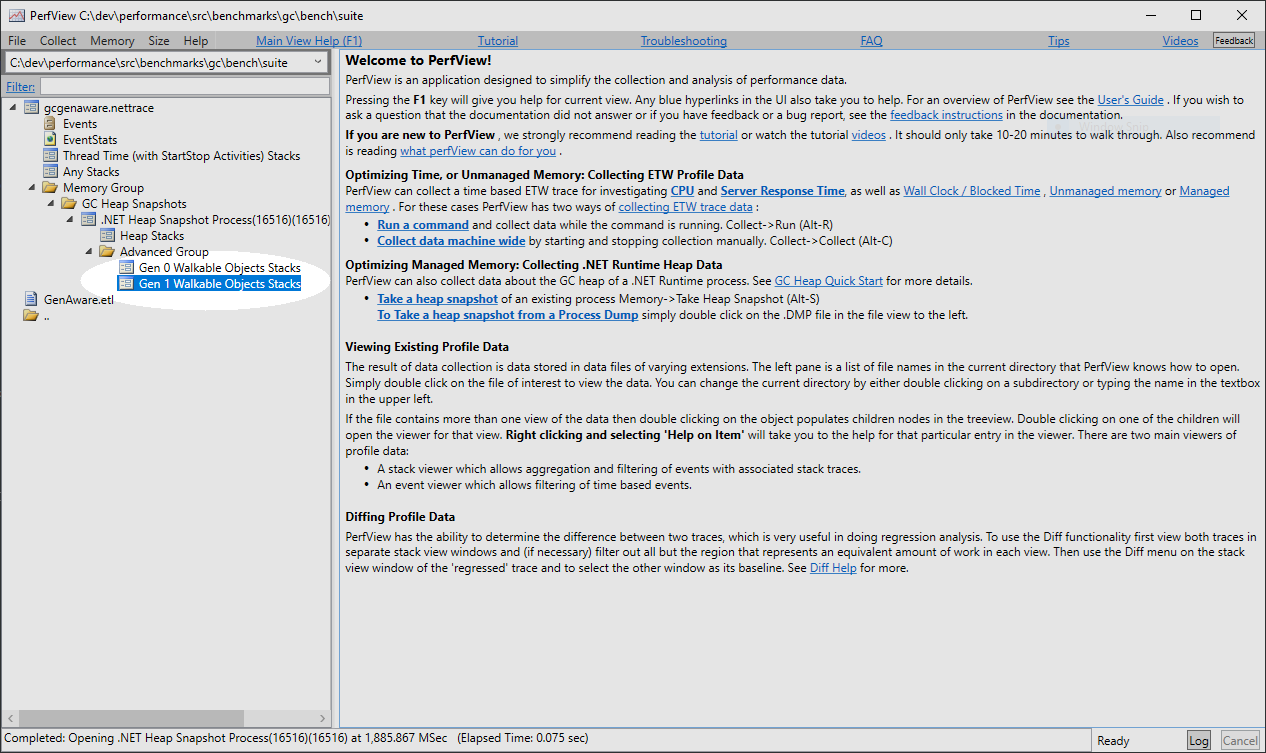
Open the gcgenaware.nettrace in PerfView will give us a generational aware view. Double click on the tree view until we see this:

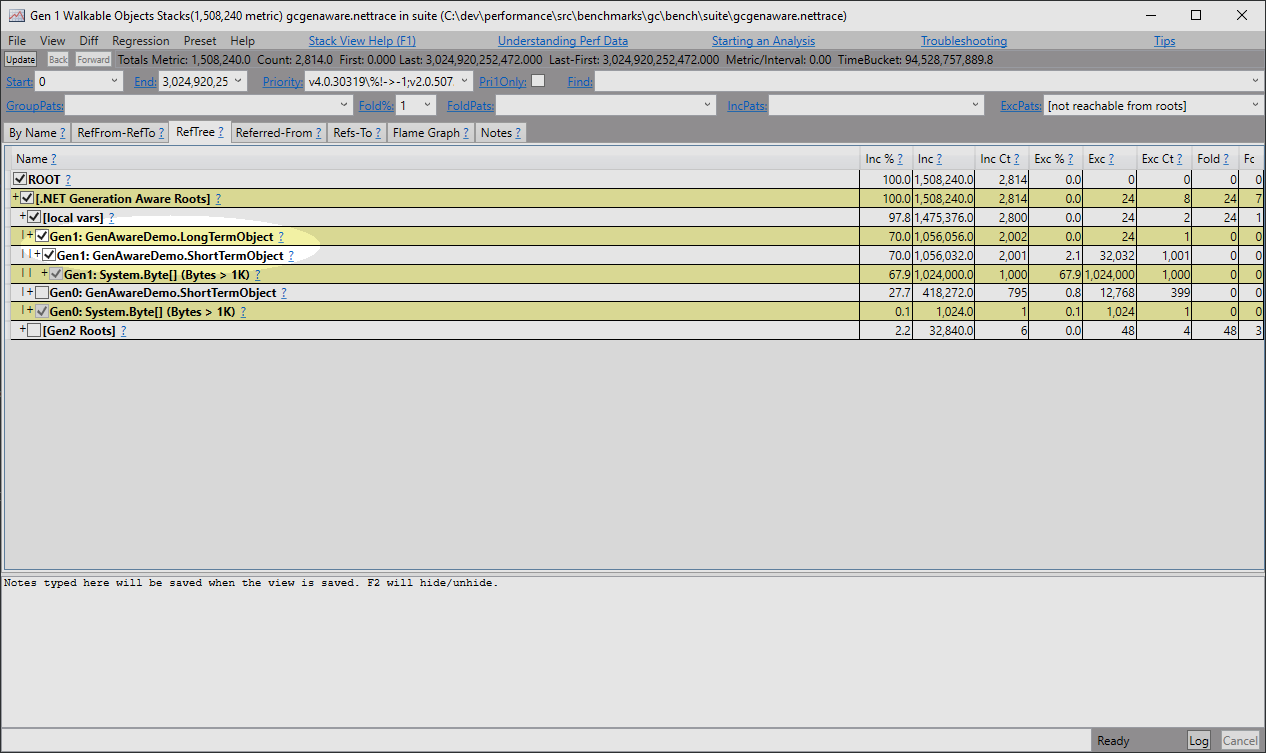
Double-clicking on the Gen 1 Walkable Object Stacks will lead us to this window.

We can analyze the heap as usual, except now types are annotated with their generation. Now we know that there is a link between LongTermObject and ShortTermObject. This is just a heap dump, so we still do not know why a LongTermObject is referenced by the ShortTermObject, but we know they are referenced.
Remember we were capturing this trace when a gen 1 GC promoted more than 1.5 MB, that object explains why that promotion happened. Hopefully this edge is sufficient to discover what is wrong in the code.
Collecting a dump
In some scenario, it would be beneficial to collect a dump. For example, if the leaking is caused by setting a static field, it will be shown in PerfView as being held by a pinned object array, but you will not know which field it is. Another common case is the leak is caused by a delegate, in this case, it will be shown as an Action<T>, in which you will not know which method is causing the leak. Either case, we can figure that out in the debugger if we have a memory dump.
To collect a dump, we can use the new environment variable introduced in .NET 6
set COMPlus_GCGenAnalysisDump=1
This will collect a dump in addition to the trace we already collected. If a dump is sufficient and you would like to avoid collecting a trace as well, we can disable the tracing by setting this new environment variable:
set COMPlus_GCGenAnalysisTrace=0
The generated dump is called gcgenaware.dmp and it can be analyzed with a debugger.
Diagnosing a promoted byte spike
In this following, I will describe what we missed earlier. How do we know there is a promoted byte spiking problem to begin with?
Collecting a trace
To detect the fact that there is a leak of a pile of ephemeral objects into the next generation, we leverage the fact that the ephemeral generation GC will have a spike in the promoted bytes.
I ran PerfView with GCCollectOnly and collected a trace. In and administrative prompt, we can run
perfview /GCCollectOnly /nogui collect
and press ‘S’ when this is done. This will create a zip file containing the trace in the current directory.
Analyze the trace
The GC performance infrastructure is available as a subdirectory in the dotnet/performance repo. The README is generally up-to-date. Just clone the repo and follow the instruction you will have a basic setup. Note that you do NOT need to run a benchmark, in this post, we will use it only to analyze a collected trace. Make sure we also set up the prerequisites for using the Jupyter notebook.
Preparing for analysis
To get started, unzip the collected trace and rename the etl file to GenAware.etl. I placed the file under C:/GenAware folder. To help the infrastructure, we create a test_status_file. the daunting appearance of the file is only apparent, we can get by with a tiny file with just these 3 lines.
success: true
trace_file_name: GenAware.etl
process_id: 1348
Of course, the process_id needs to match file the program’s output.
Create a plot
Open jupyter_notebook.py in Visual Studio Code. Again, the daunting pile of code in the notebook is only apparent. All we needed is the first cell. All the code in the other cells is meant to be examples. We can just ignore them.
The notebook loads the trace and makes it available as a Python object, we can create a plot out of it. Here is what I did to gather all the gen 0 GC promoted bytes and make a plot.
#%%
_TRACE = get_trace_with_everything(Path("C:/GenAware/GenAware.yaml"))
metrics_dict = {}
metrics_dict["promoted_bytes"] = []
for gc in _TRACE.gcs:
    if gc.Generation == Gens.Gen0:
        metrics_dict["promoted_bytes"].append(gc.unwrap_metric_from_name("PromotedMB"))
    else:
        # Just to make sure the x-axis corresponds to the GC index for filtering.
        metrics_dict["promoted_bytes"].append(0)

metrics_frame = pandas.DataFrame.from_dict(metrics_dict)
metrics_frame.plot()
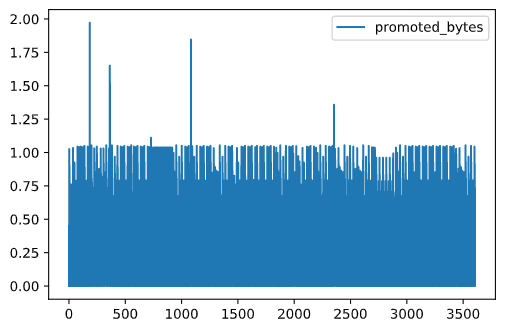
The first line #%% indicates that this is a new Jupyter notebook cell that can be run independently. The rest is mostly just copied and pasted from the templates and makes a plot. Here is how the plot looks like:

So we confirm there is indeed a spike in the promoted bytes. Not just that, the ’normal’ promoted bytes never exceed 1.0, which is measured in MB. Earlier we said the lists have 1000 elements of size 1000 bytes, that is why we normally promote at most that much (the worst case happen when the list is about to be discarded but just not quite because the next iteration haven’t started to overwrite that variable yet)